Moving from "share data because you should" to "share data because you'll get something back."
Looking for Surprisals in your data using AstaLabs Autodiscovery from Allen AI
I founded Figshare over a decade ago with a simple thesis, if you make research data openly available, good things will happen. Things you can't predict.
This week, I got a rather specific reminder of why that thesis holds up. Allen AI have just launched AutoDiscovery, an experimental tool inside their AstaLabs platform. Most AI tools for research, like Google's AI co-scientist and FutureHouse are goal-driven. You bring a research question, they help you answer it. AutoDiscovery flips that. You give it a dataset, and it generates its own hypotheses, writes Python code to test them, runs statistical experiments, and uses Bayesian surprise to surface the results worth paying attention to.
Before running an experiment, the system holds a prior belief about whether a hypothesis is true (derived from the LLM's world knowledge). After seeing results, it updates to a posterior. The surprisal is the magnitude of that shift. ie. how much the evidence forced the system to change its mind. To navigate the vast space of possible questions, it uses Monte Carlo Tree Search to balance exploration with exploitation. In their evaluation across 21 datasets, AutoDiscovery produced 5–29% more surprising discoveries than competing approaches, and two-thirds were also surprising to human domain experts.
I wanted to test it with data that lives on Figshare. So I picked three datasets that I knew were relatively FAIR as they have been cited multiple times.
Dataset 1: Brain tumours
Jun Cheng's brain tumor dataset: 3,064 T1-weighted contrast-enhanced MRI images, three tumour types, CC-BY 4.0, on Figshare since 2015. I ran 10 experiments. Most hypotheses confirmed (what I am led to believe are) textbook expectations - gliomas show higher textural entropy than meningiomas (reflecting heterogeneous malignant tissue versus more homogeneous benign structure), pituitary tumours sit centrally in the brain, meningiomas exhibit higher morphological circularity, and a simple geometric classifier can distinguish between the three types above chance. Low surprisal scores across the board, the system's beliefs validated by the data.
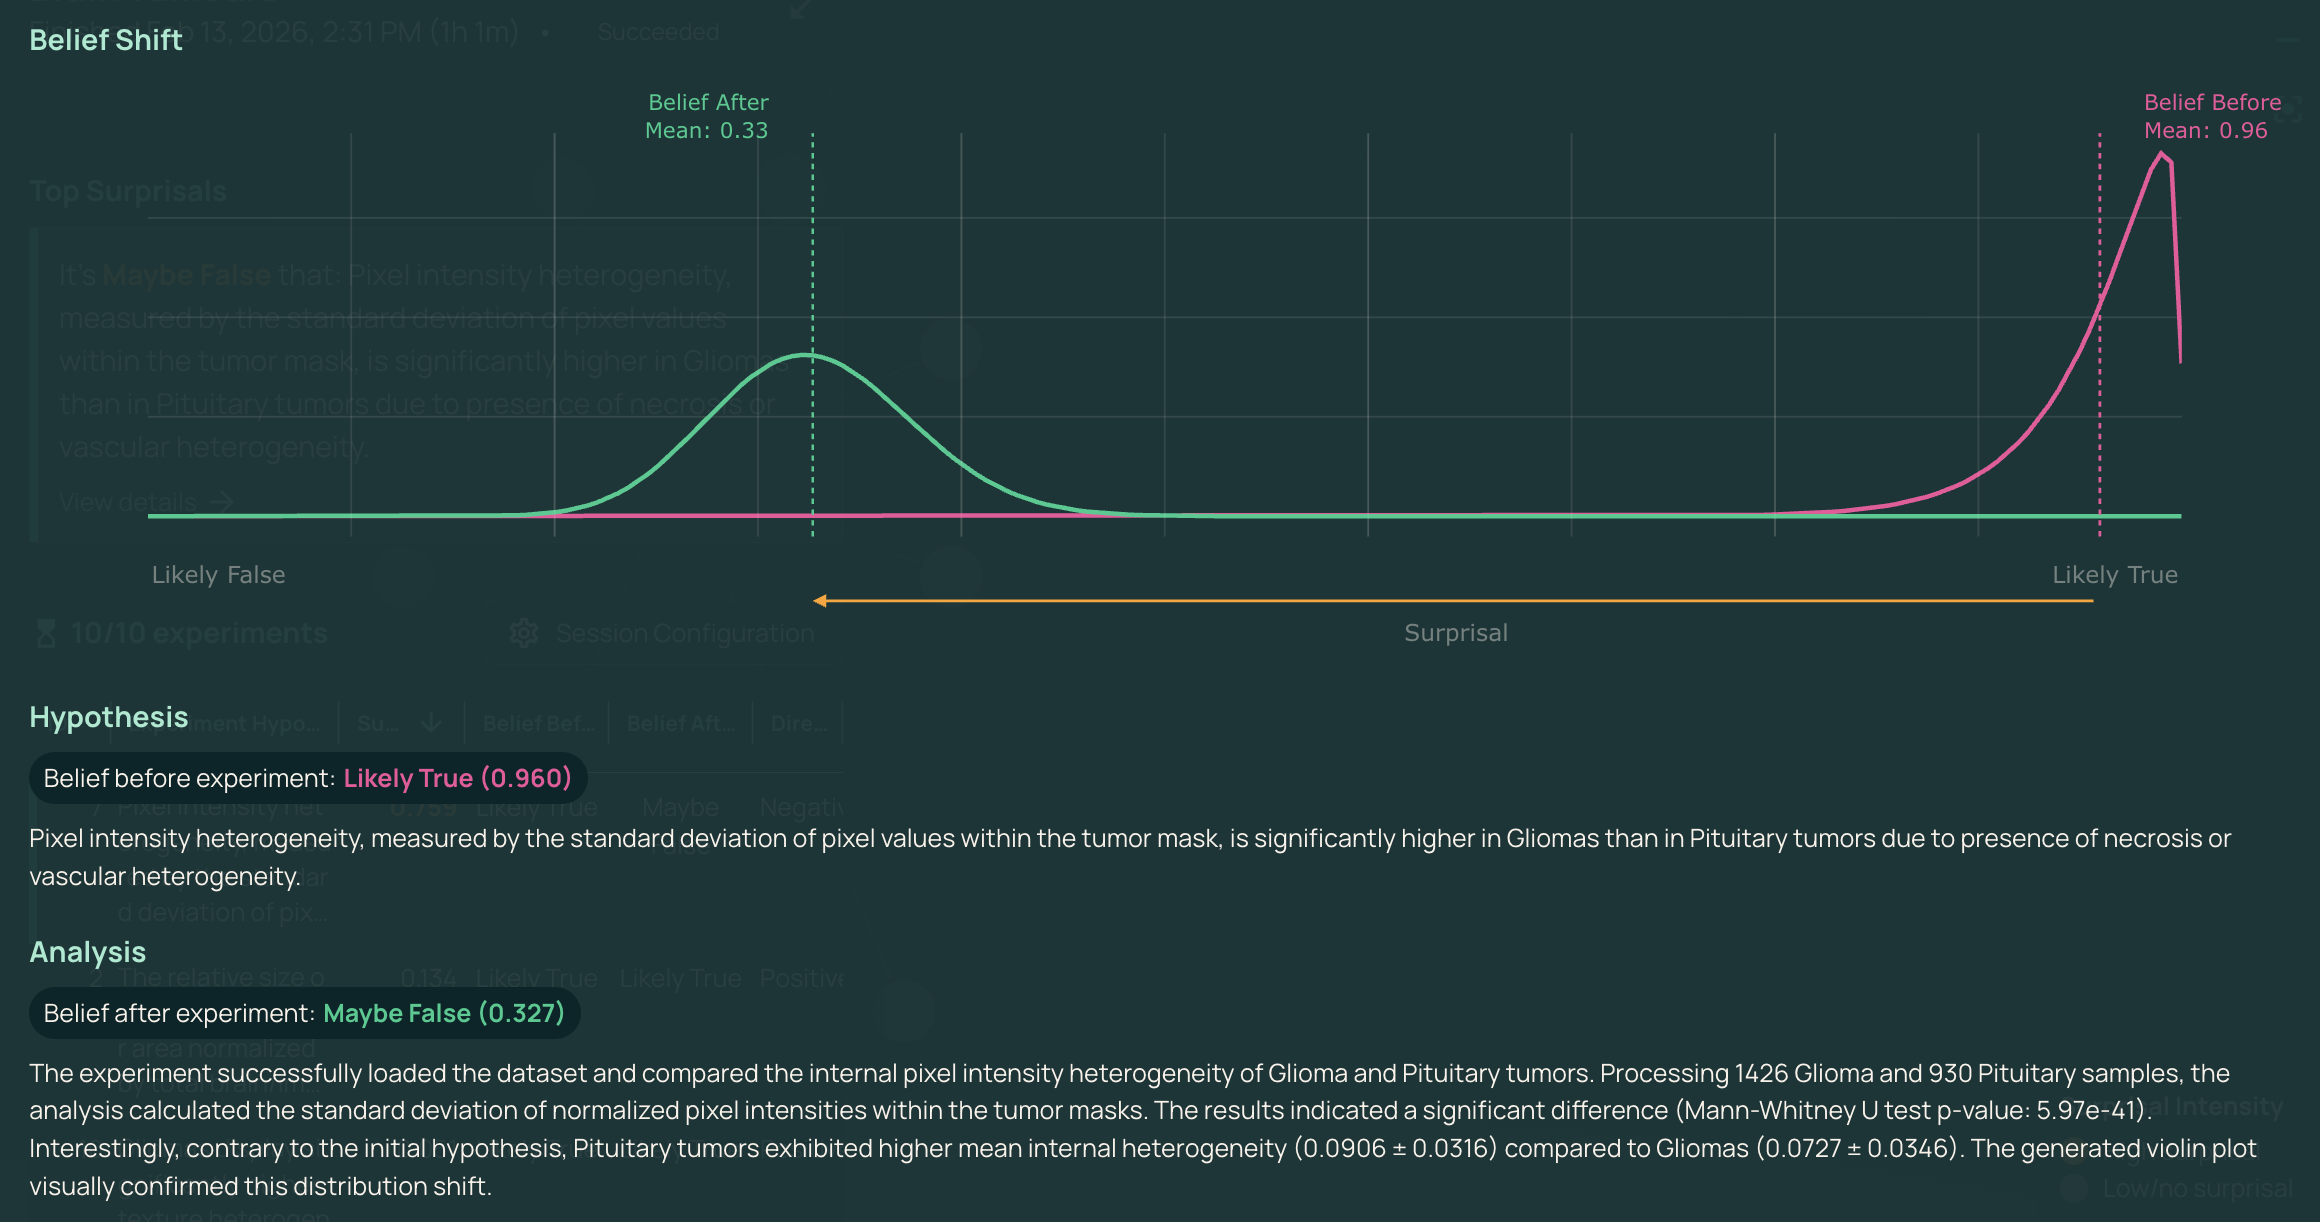
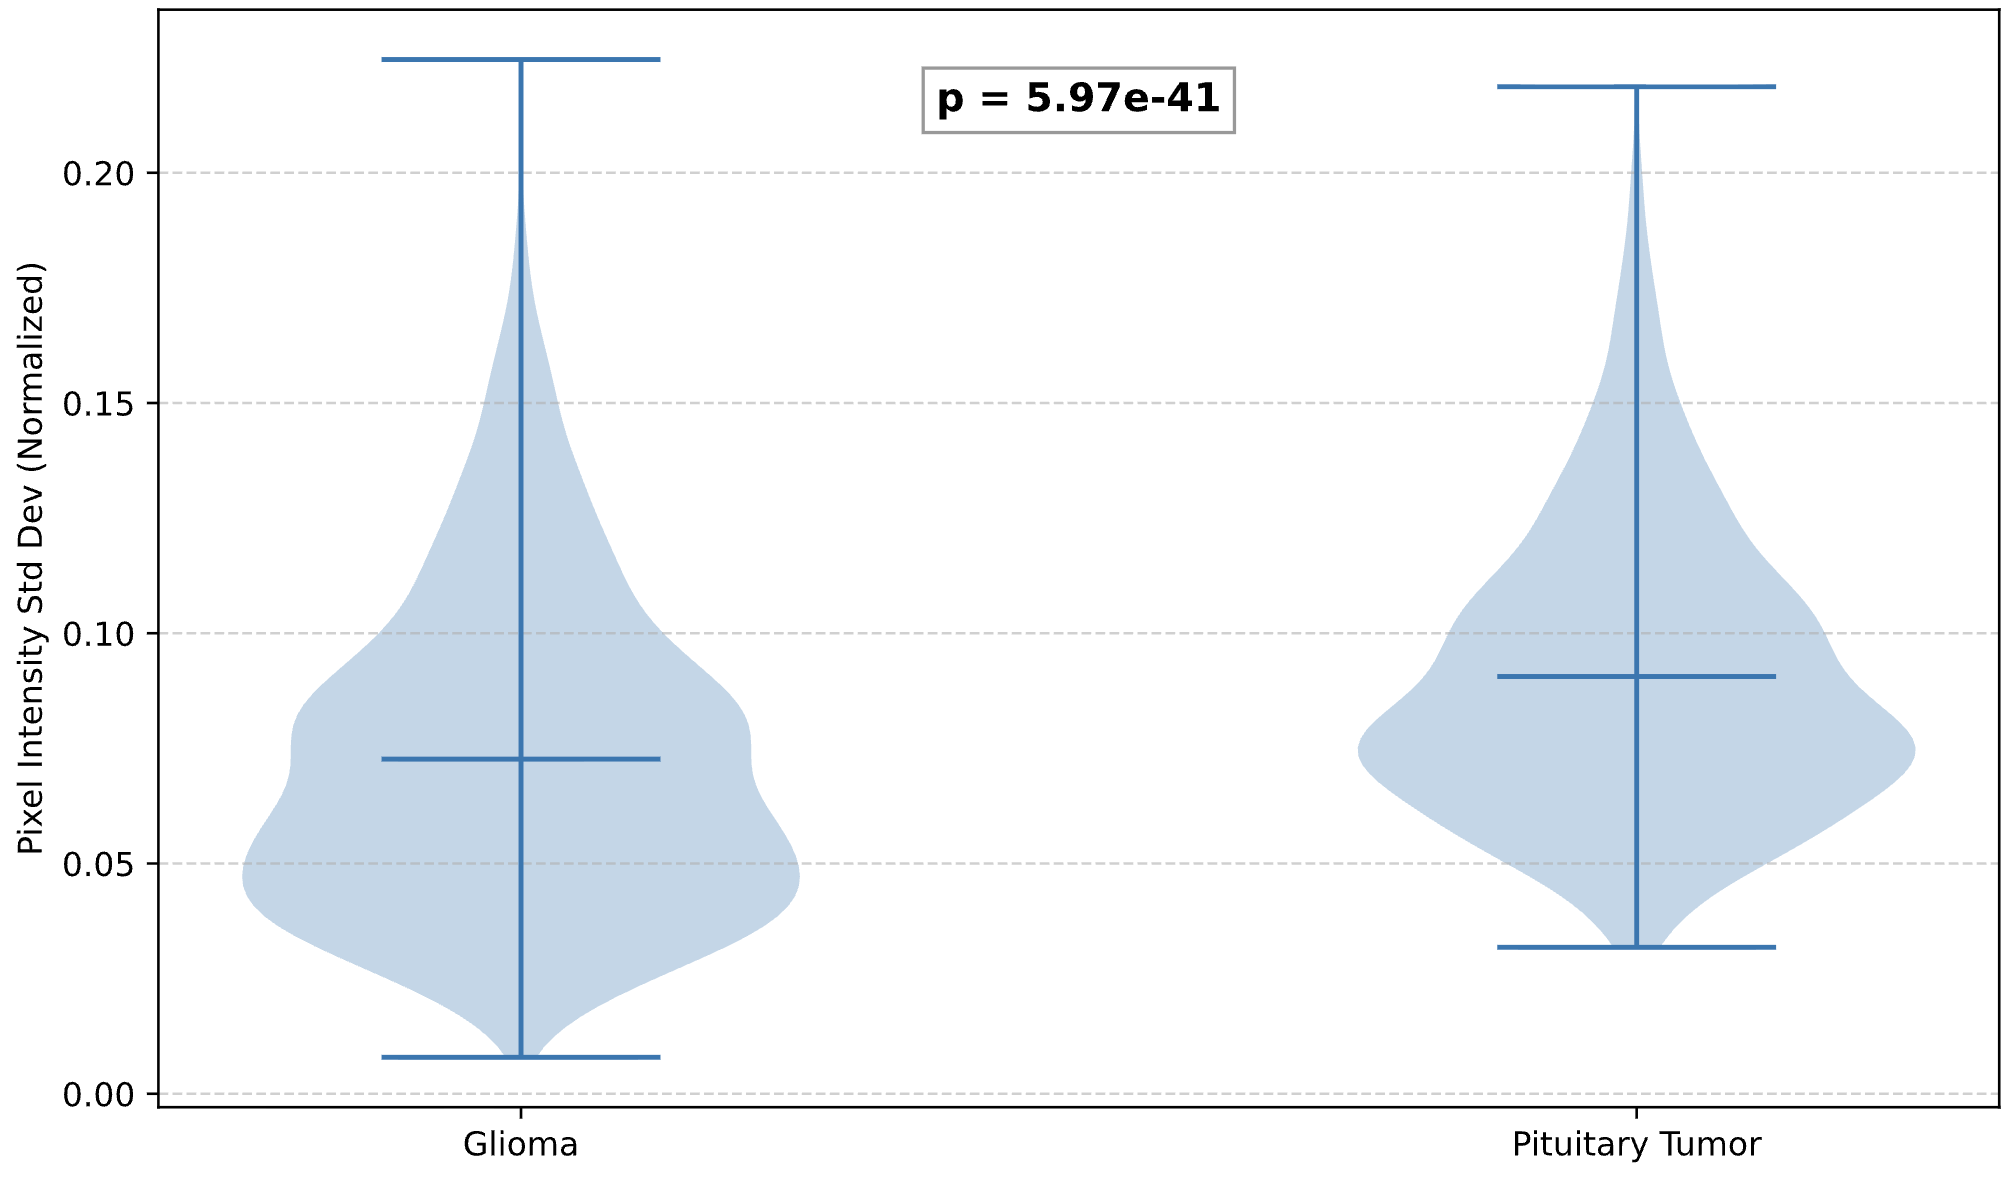
One standout finding was different. AutoDiscovery hypothesised that pixel intensity heterogeneity would be significantly higher in gliomas than pituitary tumours, reasoning from necrosis and vascular heterogeneity. Prior belief: 0.96. The data found a significant difference (Mann-Whitney U, p = 5.97 × 10⁻⁴¹), but in the opposite direction — pituitary tumours showed higher heterogeneity (0.0906 ± 0.0316 vs 0.0727 ± 0.0346). Belief dropped to 0.327. Surprisal: -0.759. Not wrong in the sense of a failure, but wrong in the sense that matters for science: evidence meaningfully shifting expectations.
Dataset 2: Global aridity
Trabucco and Zomer's Global Aridity Index: high-resolution (30 arc-second) global raster climate data for the 1970–2000 period, now on its seventh version. This has been a workhorse of climate and land-use research for years, cited extensively across the environmental sciences.
A cluster of hemispheric aridity hypotheses produced the highest surprisal scores. The system predicted the Southern subtropical belt (20°S–40°S) would have a higher mean Aridity Index (more humid) than the Northern belt (20°N–40°N), reasoning from land-ocean ratios. Prior: 0.984. The Northern belt turned out significantly less arid (mean AI ~0.176 vs ~0.070, Welch's t-test p < 0.001). Belief after: 0.335. Surprisal: -0.778.
AutoDiscovery's prior was shaped by the intuition that the Southern Hemisphere has more ocean, the actual landmass between 20°S and 40°S is dominated by Australian desert, the Kalahari, and the Atacama. The Northern belt, despite the Sahara, includes the humid Southeastern US and East Asia. The system taught itself some geography by being surprised by data.
The run also confirmed expected patterns lower in the table: aridity gradients are steeper at the desert edge than the forest edge, evapotranspiration correlates more strongly with latitude than aridity does, and Madagascar exhibits a sharp longitudinal climatic divide.
Dataset 3: Permeability estimation
The most niche test: pressure and viscosity logs by Khirevich, Yutkin, and Patzek - high-precision flow measurements through porous media, hosted on Figshare+, supporting a paper in Physics of Fluids.
The top surprisal - the system predicted fluid temperature would increase monotonically due to mechanical pump heating, introducing systematic drift. Prior: 0.831. Rejected cleanly, linear regression across all six experimental series showed temperature slopes ranging from -0.0062 to +0.0122 °C/hr, no consistent direction, and only one series with a statistically significant trend. Temperatures stayed within a narrow 21.2–22.0°C band throughout. Belief after: 0.283. Surprisal: -0.657.
This is arguably the most practically useful kind of finding. AutoDiscovery ran a quality-assurance check on the experimental setup and confirmed a plausible source of systematic error wasn't there, exactly the kind of analysis that strengthens confidence in published results.
What this means for open data
There's a satisfying circularity to this experiment. Figshare was built on the premise that research data should be persistently available, properly licensed, and machine-accessible. A decade later, I'm feeding Figshare-hosted datasets into an AI system that autonomously generates hypotheses against them. The datasets have DOIs, open licences, versioning. They just work.
But I think there's something more significant here than a nice demonstration.
The persistent challenge in open data advocacy has been the incentive question. Researchers are told to share because funders mandate it, because it aids reproducibility. All true. But for the researcher who spent three years collecting data, the question remains - what's in it for me?
Tools like AutoDiscovery offer a new answer. Share your data, and an AI system will generate hypotheses you might never have tested, surface patterns that could open new lines of inquiry. It will come at your data with different priors to yours, ask questions from outside your disciplinary frame. The value proposition shifts from "share because you should" to "share because you'll get something back." Imagine every deposited dataset receiving an automated run with researchers getting a report of surprising findings alongside their download metrics.
This also reframes what it means to build on research that came before. The traditional cycle of publish, read, design new study, collect new data, takes years. AutoDiscovery collapses that to hours. It brought its own hypotheses to Cheng's tumour data, Trabucco and Zomer's climate data, Khirevich and colleagues' permeability logs, reusing their data in ways they almost certainly hadn't imagined when they deposited it. That's rather the whole point of making data FAIR. The reusable bit has always been the hardest to demonstrate. Tools like this make it tangible.
Try it
The tool has limitations. The surprisal metric inherits the LLM's biases, many confirmed hypotheses would be obvious to domain experts, and as Allen AI themselves note, outputs are starting points for investigation, not finished science. But the full transparency into code and statistical methods makes everything auditable and reproducible.
Allen AI are offering 1,000 free credits through end of February 2026. If you've got data sitting in a repository like Figshare or anywhere else, point AutoDiscovery at it and see what comes back.
The datasets researchers have been quietly sharing all this time might just turn out to be more valuable than anyone expected.